glTF in Unity optimization - 8. Asynchronous Scene Instantiation
This is part 8 of a mini-series.
TL;DR: Asynchronous instantiation reduces frame rate drops on big scenes (i.e. scenes with many nodes and lots of content), but it required breaking more of the API
than I presumed.
Introduction
glTFast currently loads a glTF file in two phases.
- Reading the source glTF and converting it to Unity resources (meshes, materials, textures)
- Instantiation: Actually creating GameObjects/Entities of a glTF scene
The whole process might exceed the computational time budget available for a single frame and thus causing stutter. That's why async programming was used to spread work across frames, but unfortunately this was only done for the first phase. This post is about the adventure of making phase 2 async as well.
Preparation
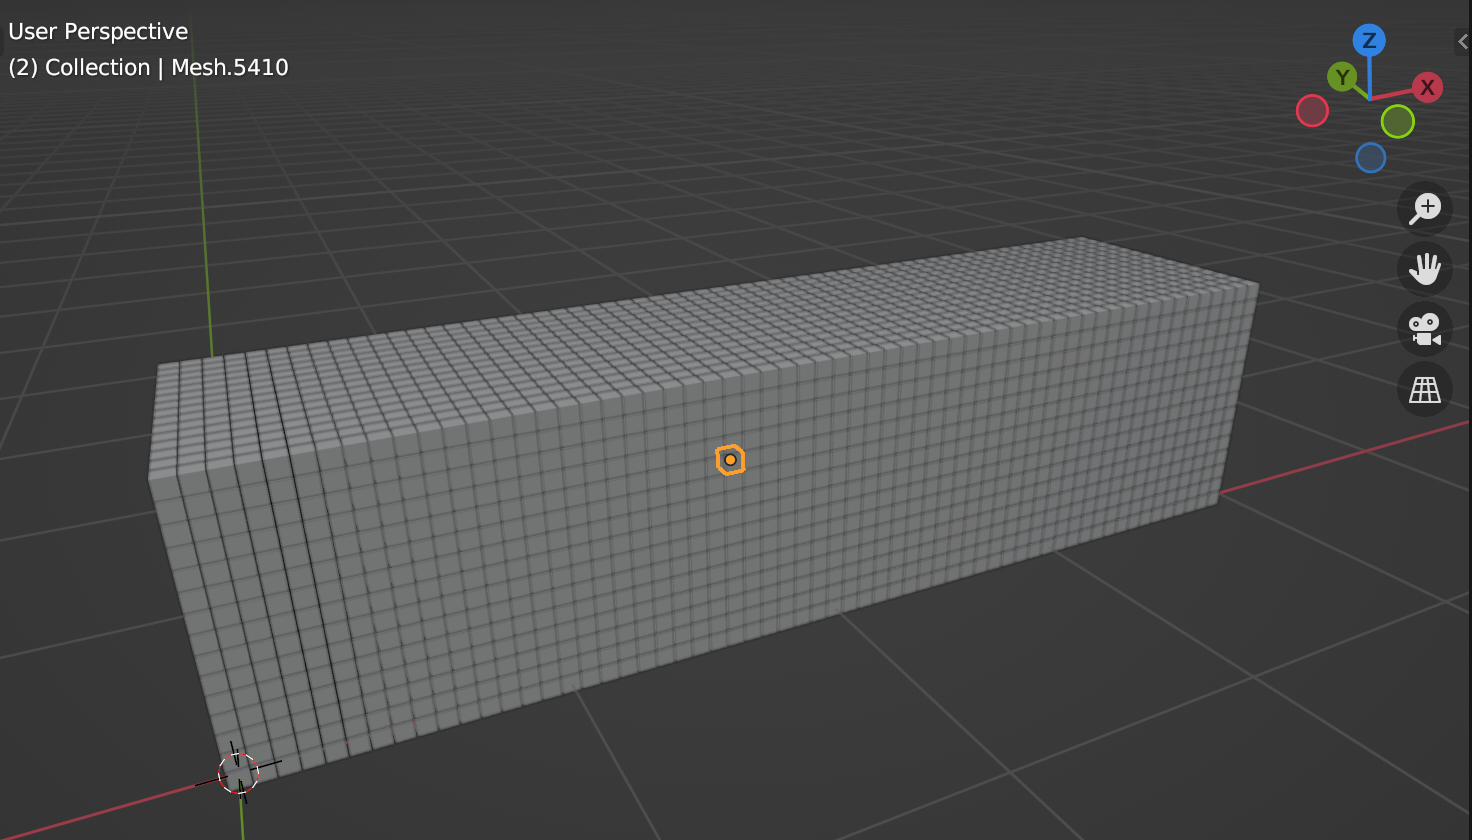
First, we need proper test scenes. From previous day-to-day observations I know that scenes with many nodes (and lots of content in general) perform worst and make the frame rate stutter apparent. To create such a test glTF I used Blender and a small python script, that creates thousands of cubes.
import bpy

# count - final count will be 15 to the power of 3 = 3375
c = 15
size = .95/c
# Pick a mesh from a previously created cube
m = bpy.data.meshes['Cube']
for x in range(c):
    for y in range(c):
        for z in range(c):
            bpy.ops.object.add(type='MESH',location=(x/c, y/c, z/c))
            obj = bpy.context.active_object
            obj.scale=(size, size, size)
            obj.data = m
To my negative surprise this script took quite some time to execute. It could probably be sped up by creating the objects in bpy.data and linking it to the scene instead of using the bpy.ops.object.add operator, but I'm here to optimize glTF loading, not this helper script. So I decided to refill my glass of water in the meantime and manually duplicate the resulting cubes a couple more times to have an even bigger scene. It ended up with 13,500 nicely arranged cubes.

Baseline
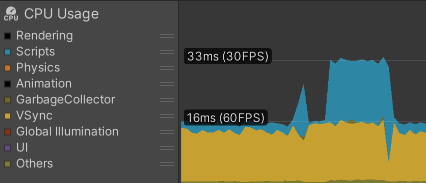
Overall it takes between 550 and 580 ms to load the model. As expected, frame rate is smooth until instantiation. Here's that nasty last frame that takes ages:

The instantiation blocks execution for 353 ms and the frame overall takes almost half a second. Key observation breakdown:
- 54 ms creating GameObjects
- 250 ms populating the hierarchy (e.g. adding
Renderercomponents) - 33 ms adding the scene (22 ms of that was parenting root nodes to the scene GameObject; more on that later)
Baseline DOTS
I also tested the experimental DOTS support. Loading time in the Editor is really bad (almost one second), but quite fast in builds:
- 250 ms to 300 ms overall
- 133 ms for the last (instantiation) frame
Let's see if we can do something about it.
First Async Attempt
The first approach was to make the instantiation methods async and add breakpoint in between creating or altering GameObjects.
A problem that surfaced right away was that now also half-way loaded scenes are already rendered. A quick solution was to de-activate all GameObjects right after they are created and activate them at the end, after all of the scene is ready. The IInstantiator API does not offer a final callback, so I crammed that into AddScene, which is not very clean, but does the job for now.
Here's the first result:

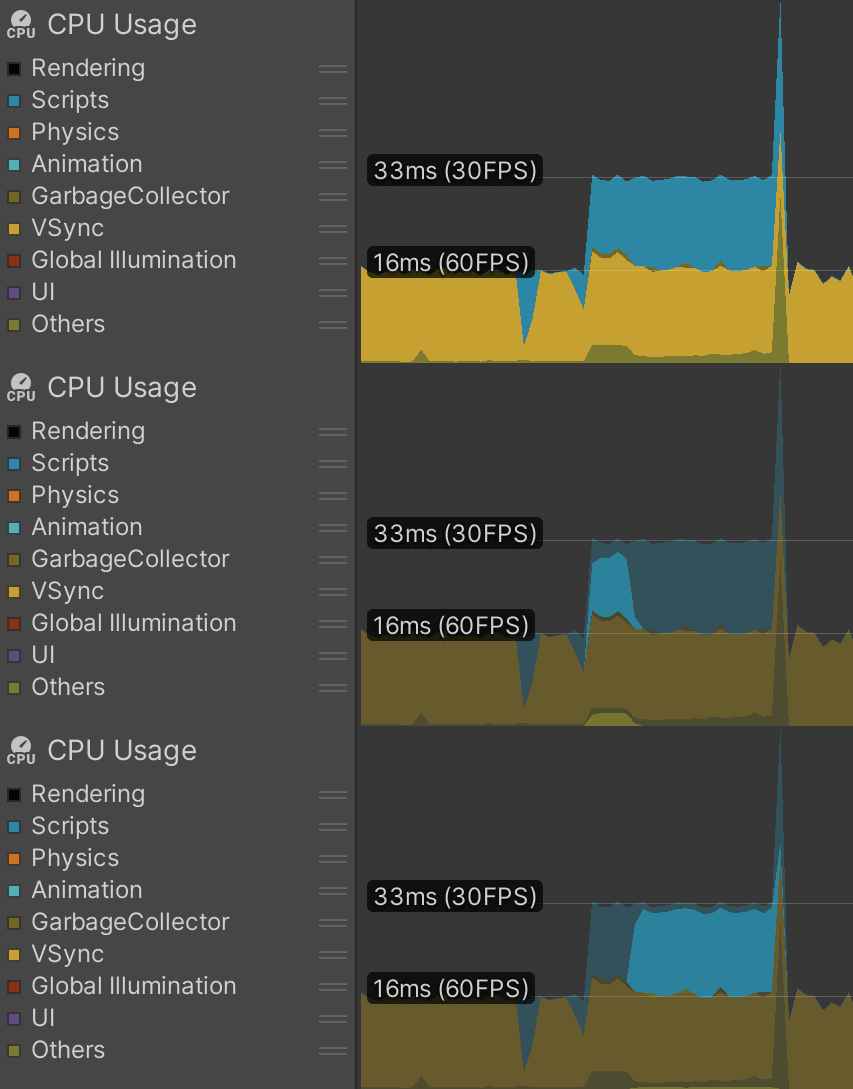
Although the frame rate drops from 60 to 30 (which could be tweaked), most of the work is spread evenly now. First highlight is GameObject creation and following portion is adding components.
What's problematic is that there is still a sharp spike in the end. Let's look at this frame in detail.

Breakdown of causes of this 200 ms frame time:
- Scripting
- 56 ms
AddScene- 20 ms Re-parenting root nodes onto scene GameObject
- 22 ms activating all nodes so that they are rendered correctly
- 56 ms
- Engine
- 122 ms
PostLateUpdate.FinishFrameRendering
- 122 ms
It's a bit scary that the engine takes 122 ms, but I assume it's a consequence of the way the scene is assembled. Instead let's focus on the scripting part and AddScene, since we're in direct control of that.
Re-parenting thousands of nodes takes some time. We could go ahead and make AddScene itself async to split it up, but I'd like to address a deeper conceptual problem here. Re-parenting a GameObject has a certain computational overhead (that becomes even bigger if it has a deep hierarchy of children). To avoid this overhead, it's best to create hierarchies from the root upwards without any unnecessary re-parenting. glTFast does not do this currently.
IIRC glTFast instantiation historically worked like this:
- Create all nodes upfront (i.e. nodes of all scenes;
IInstantiator.CreateNode) - Parent non-root nodes to their respective parent node (in
IInstantiator.SetParent) - Add components
- Add the scene, which parents all root-level nodes/GameObject to the scene GameObject (
IInstantiator.AddScene)
This was nice (I thought) since it did not require the overhead of iterating the hierarchy tree in a particular order. At some point support for scenes was added, and then iterating a scene's node tree had to be done anyways (see GltfImport.InstantiateSceneInternal.IterateNodes).
Refactor API
The obvious thing to do now is to create the scene hierarchy starting from the root, so that a parent is always created before its children and parented right away. GltfImport.InstantiateSceneInternal already iterates nodes in that order, but we have to refactor IInstantiator to pull this off. The new approach is:
- Create the scene (which certifies and prepares the root level GameObject)
- Create nodes (in correct order and parented right away)
Also, previously the scene's node tree was iterated twice. Once for creating the raw hierarchy and a second time to add components (like Renderer, etc.). We can now do it in one go.
While the overall loading time did not suffer much at all the worrying last frame improved a bit.

EndScene, the logical successor of AddScene now takes less than 16 ms instead of 56 ms. I book that as a success, even though the engine itself still spends a lot of time preparing the rendering. Still the last frame is now at around 100 ms instead of 450 ms for this corner-case benchmark file.
DOTS
Besides adopting the EntityInstantiator to the new IInstantiator API I had to fix the visibility problem of half-way loaded scenes as well.
In the Editor this still perform really bad. Up to 4 full seconds to load the test file. I haven't certified, but I blame the DOTS Editor UI for the overhead.
Briefly I thought about optimizing this API for DOTS right away. At the moment I create each node one at a piece via EntityManager.CreateEntity, which the documentation says this about:
Creating entities with the EntityManager is typically the least efficient method
Spawning them all at once in a job seems to be a better solution, but it is a bit more complicated to calculate the number of required entities (which is not necessarily the number of nodes) upfront.
Taking a look at an actual build (which you should always do), the test file loads in ~400 ms overall with maximum frame times below 33 ms.

Even if it's slower overall, the frame rate is quite solid and it's still better than the GameObjects workflow.
For now I decided to not optimize further, but once DOTS nears maturity, I'll definitely have to revise this part.
Side Quest - Materials Count
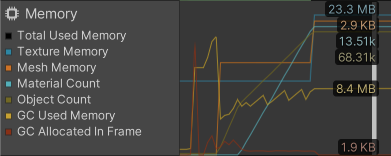
While benchmarking the test scene I noticed that there was an absurd high count of materials, one per cube to be precise.

The glTF does not contain any materials, so they fallback to the default material. What's going on?
Turns out the fallback material was not cached and re-generated on every occasion. Another small fix along the way.
Conclusion
Reducing maximum frame time from 450 ms to 100 ms (GameObject) and 133 ms to 33 ms (DOTS) is quite the result I was aiming for. There's still potential for improvements (especially for the DOTS implementation), but that has to wait for later.
This work landed in glTFast's main branch and will ship in the upcoming 5.x release.
Next up
I have a couple of half-finishes ideas/posts lying around and haven't decided which one and when to finish, but I strive to put out posts more regularly in the future.
Follow me on Mastodon or Bluesky or subscribe the feed to not miss updates.
If you liked this read, feel free to
